S&P500 Daily Action Areas & Price Targets 3/8/26

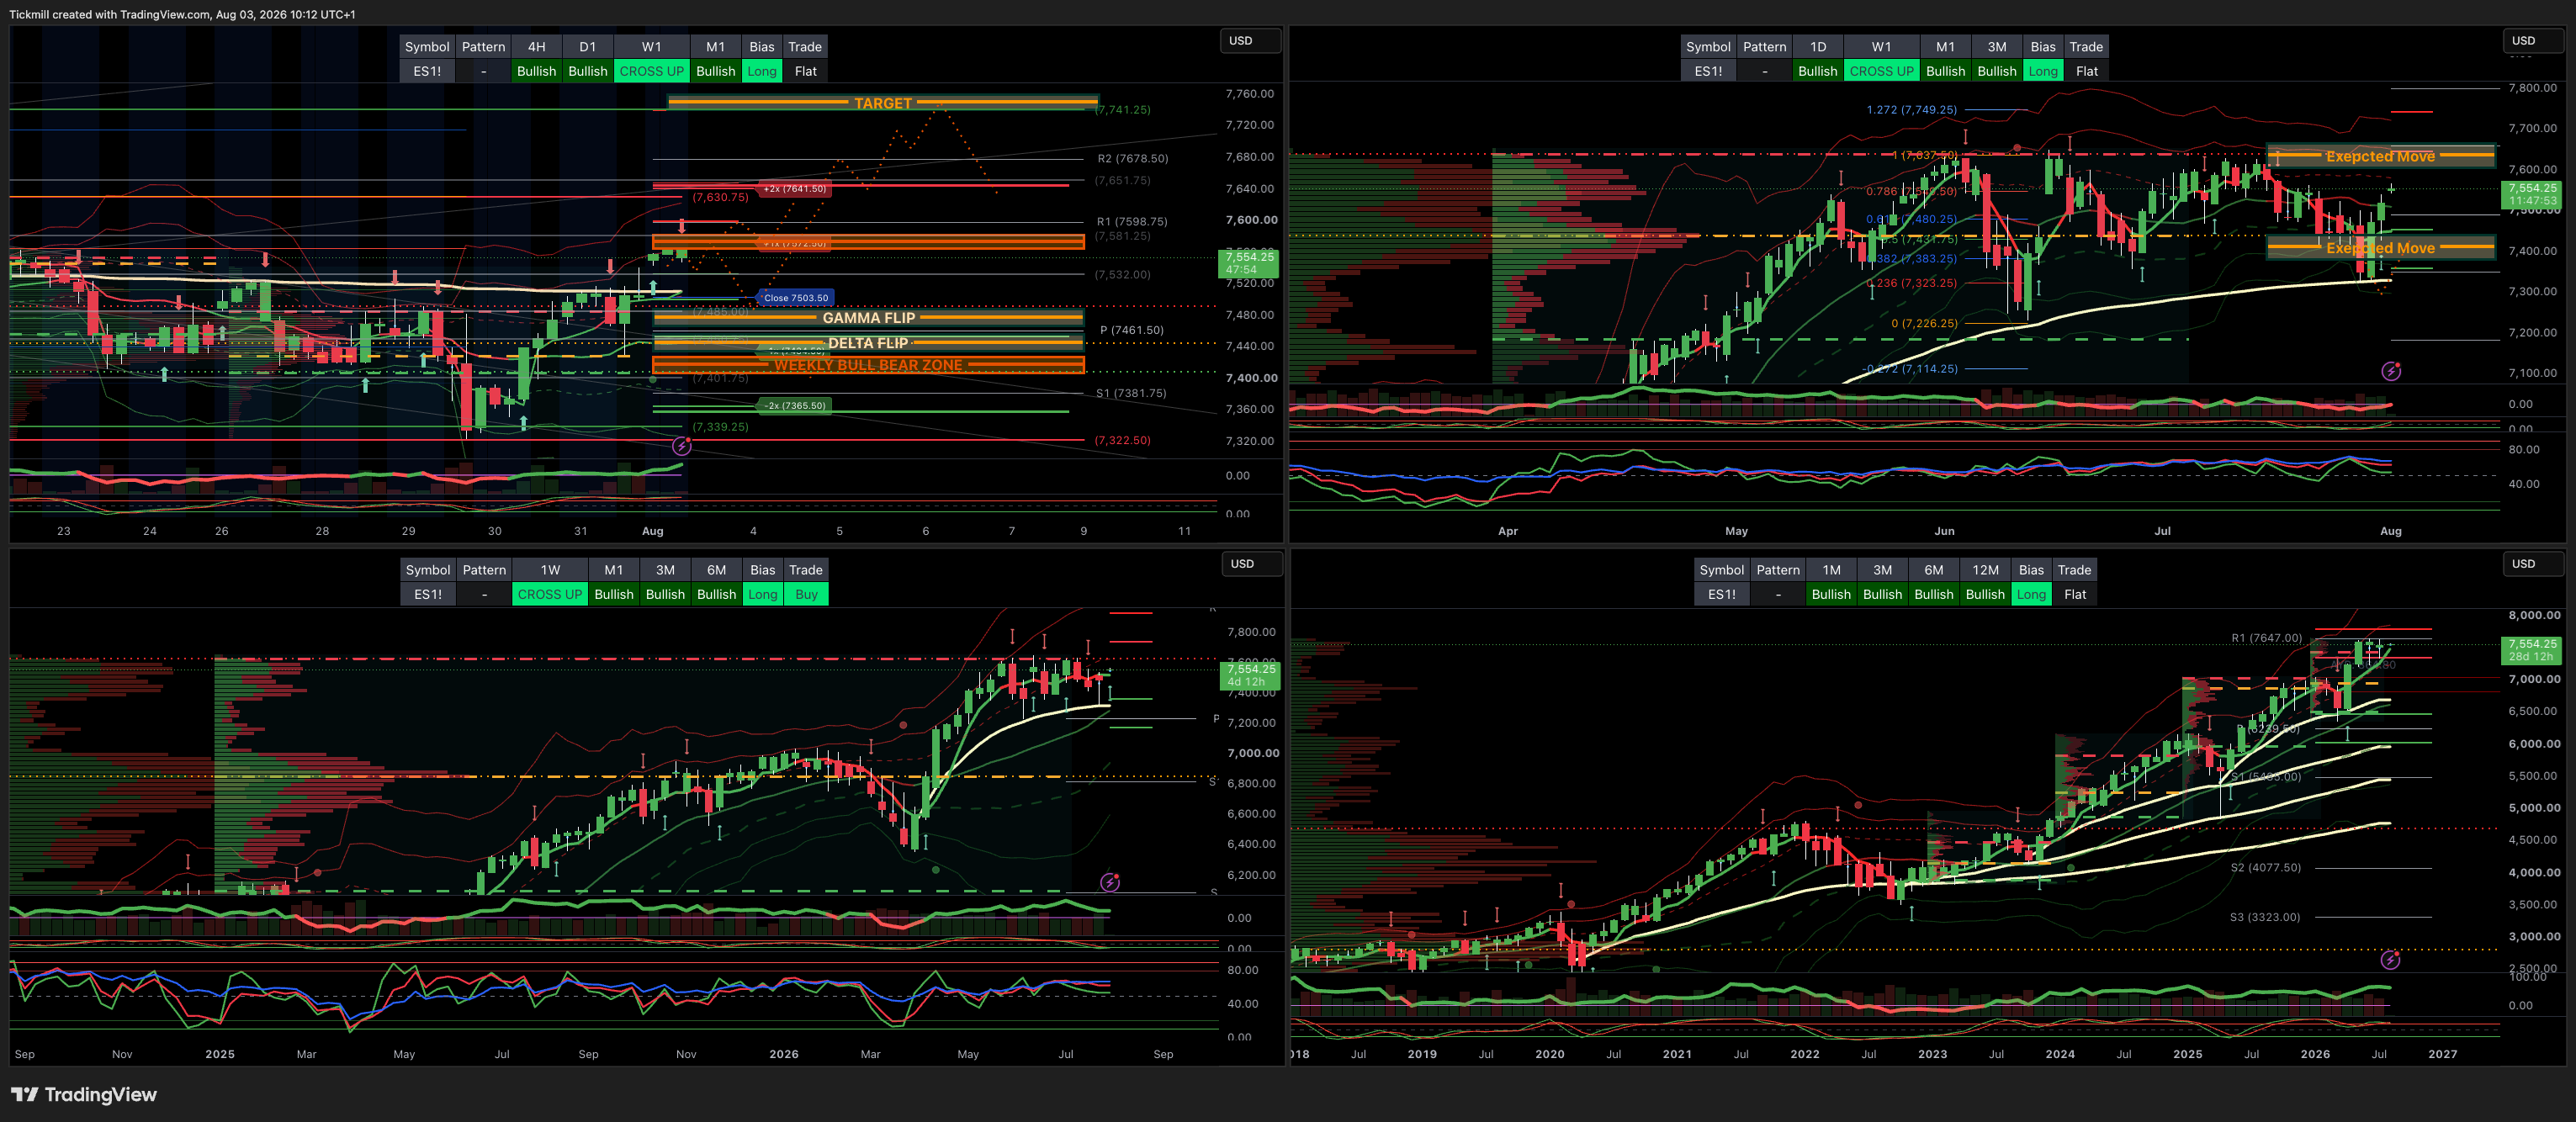
S&P500 Daily Action Areas & Price Targets 3/8/26
***QUOTING ES1! FOR CASH US500 EQUIVALENT LEVELS, SUBTRACT POINT DIFFERENCE***
WEEKLY BULL BEAR ZONE 7400/20
WEEKLY RANGE RES 7635 SUP 7410
MONTHLY RANGE RES 7838 SUP 7258
JHEQX Q3 Collar Short Call Cap: ~7,750 – 7,900 - Long Put Strike: ~7,050 – 7,100 (approx. 5% downside protection) Short Put Strike: ~5,950
DEC2025 OPEX to DEC2026 OPEX is 945 points giving us a range of [5889,7779]
SPX PUT/CALL RATIO 1.1 (The numbers reflect options traded during the current session.) A put-call ratio below 0.7 is generally considered bullish, and a put-call ratio above 1.0 is generally considered bearish.
GS Flow Desk: large S&P 31Aug 7000/7950 strangle in roughly $20mm vega / $115mm premium …My Read – classic “big convexity versus carry” trade: either someone paid a lot to own a wide August move, or someone got paid a lot to bet that the S&P stays comfortably inside the 7000–7950 corridor
DAILY VWAP BULLISH 7448
WEEKLY VWAP BEARISH 7522
MONTHLY VWAP BULLISH 7036
DAILY STRUCTURE - OTFH - 7427
WEEKLY STRUCTURE - BALANCE 7648/7247
MONTHLY STRUCTURE - OTFH - 7247
Balance: This refers to a market condition where prices move within a defined range, reflecting uncertainty as participants await further market-generated information. Our approach to balance includes favouring fade trades at the range extremes (highs/lows) while preparing for potential breakout scenarios if the balance shifts.
One-Time Framing Higher (OTFH): This represents a market trend where each successive bar forms a higher low, signalling a strong and consistent upward movement.
One-Time Framing Lower (OTFL): This describes a market trend where each successive bar forms a lower high, indicating a pronounced and steady downward movement.
DAILY BULL BEAR ZONE 7580/90
GAMMA FLIP 7478
DELTA FLIP 7445
DAILY RANGE RES 7571 SUP 7434
2 SIGMA RES 7638 SUP 7386
VIX BULL BEAR ZONE 17.9 (VVIX / VIX) 5.7
TRADES & TARGETS
SHORT ON REJECT/RECLAIM DAILY BEAR ZONE TARGET CLOSE/GAMMA FLIP
LONG ON ACCEPTANCE ABOVE DAILY BULL BEAR ZONE TARGET 7630
***ADDITIONAL SETUPS & TARGETS HIGHLIGHTED ON THE CHARTS***
(I FADE TESTS OF 2 SIGMA LEVELS ESPECIALLY INTO THE FINAL HOUR OF THE NY CASH SESSION AS 90% OF THE TIME WHEN TESTED THE MARKET WILL CLOSE ABOVE OR BELOW THESE LEVELS)
GOLDMAN SACHS FICC & EQUITY TRADING DESK VIEWS
Momo Capitulation Is Mature, but the Rebound Will Be Choppy
Goldman’s latest factor/thematic note argues that the July momentum crash was historic. High-beta momentum delivered its worst one-month performance since the GFC, and thematic / factor volatility is now at post-COVID highs. The key investor debate has shifted quickly from “when do we buy the dip?” to “is this rebound sustainable?”
The answer is nuanced:
The technical unwind is likely in the later innings, but elevated factor vol, macro uncertainty, and mixed AI capex narratives argue for limited-loss upside structures rather than outright chasing.
Goldman’s preferred stance is to selectively buy AI hardware / bottleneck exposure, fade structural losers that squeezed during the unwind, and keep protection around August / September political and macro risks.
1. Momentum Capitulation: Historic Reset, Not an All-Clear
This week’s selloff erased most of the YTD gains in both US and European high-beta momentum factors:
US high-beta momentum: GSPRHIMO
European high-beta momentum: GSPEMOMO
This comes only weeks after these factors delivered record first-half rallies. The speed and magnitude of the reversal have pushed factor vol to its highest level since COVID, while index vol remains much more muted.
That is a critical market structure point: the pain has been concentrated in factors and themes, not fully expressed in headline index vol.
Positioning Reset
GS Prime and flow data show:
Largest 3-day de-grossing since November 2022
Sharp reduction in net exposure to YTD lows across:
Momentum
Mega-cap tech
Broad AI
Fundamental long/short momentum exposure now in the 1st percentile versus the last six months
But still around the 86th percentile versus five years
Systematic long/short momentum exposure around the 34th percentile versus five years
This means near-term positioning is washed out, but the longer-term crowding impulse has not completely disappeared.
Trading Implication
The technical reset likely means most of the unwind has already happened. But because factor volatility is still extremely elevated, the rebound should be choppy.
Goldman prefers limited-loss expressions:
Trade | Indicative Cost |
|---|---|
US High Momo GSXUHMOM Sep 120% / 150% call spread | 4.50% |
EU High Momo GSXEHMOM Sep 105% call | 2.25% |
These structures reflect the idea that momentum can rebound, but outright delta exposure is still dangerous.
2. Which Dips Are Worth Buying? AI Hardware First
Goldman is most constructive on the AI hardware rebound. Despite volatility in hyperscalers, second-quarter prints reassured investors on the fundamental AI demand picture. The technical backdrop has also improved after the sharp de-grossing.
The preferred AI dip-buying areas are:
Theme | Goldman Basket |
|---|---|
US Datacentres | GSTMTDAT |
EU Semis | GSSBSEMI |
EU Broad AI | GSXEAICP |
Asia AI Bottlenecks | GSXABOTL |
The key reason: fundamentals remain intact. AI infrastructure demand is still strong, and positioning has been materially reduced. For example, GSTMTDAT long/short positioning has halved from its peak over the last few weeks.
That creates a better risk/reward for hardware and bottlenecks than for crowded, broad AI beta.
3. Hyperscalers: Idiosyncratic Risk Near Term, but Better Medium-Term Setup
Goldman acknowledges near-term idiosyncratic risk in hyperscalers because AI capex and monetization narratives are diverging across the group.
The market is discriminating heavily between:
Capex that drives visible revenue / operating leverage
Capex that raises ROI concerns
Cloud demand acceleration
Margin control
AI monetization timelines
But Goldman argues that over time, the market should reward hyperscaler capex if the group continues to deliver:
Accelerating revenue
Operating leverage
Strong cloud demand
Evidence of AI ROI
This matters because hyperscalers have underperformed the S&P by roughly 12 percentage points YTD. That relative underperformance creates scope for a catch-up if earnings remain strong.
Hyperscalers vs Non-Profitable Tech
Post-Fed, an increasingly unanchored long end should consolidate hyperscaler performance relative to non-profitable tech.
The logic:
Long-end yields / term premium hurt speculative, long-duration, non-profitable tech more.
Hyperscalers have earnings, cash flow, scale, and balance-sheet strength.
If rates stay volatile, the market should prefer profitable AI platforms over unprofitable growth.
Goldman highlights that hyperscalers versus non-profitable tech performance has dislocated from the historical relationship with rates. That dislocation can normalize in favor of hyperscalers.
4. SPXXAI: The Best Hedge Became a Winner
SPXXAI has been the most robust hedge for the AI meltdown over recent weeks. It hit an all-time high on Tuesday before giving back some performance as investors began re-grossing AI exposure.
But Goldman makes a broader point:
SPXXAI is also the ultimate AI winner.
Why? Because as silicon and inference costs decline, AI benefits broaden beyond infrastructure suppliers to companies that adopt AI and use it to improve productivity and earnings leverage.
This is a crucial evolution in the AI trade:
Phase 1: Infrastructure Winners
Semiconductors
Datacenters
Power
Cooling
Networking
Memory
Equipment
Phase 2: AI Adopters
Non-AI companies using AI to cut costs
Productivity beneficiaries
Software adopters
Industrial automation users
Services companies with operating leverage
Companies improving margins through AI deployment
So while SPXXAI worked tactically as a hedge, Goldman sees it as a strategic beneficiary of AI diffusion.
5. Rallies Worth Fading: Structural Shorts Have Re-Opened
The momentum meltdown caused structural shorts to squeeze sharply higher. Goldman sees that as a rare re-entry point for medium-term shorts.
AI-at-Risk
The key baskets:
Basket | Recent Rally |
|---|---|
US AI at Risk, GSTMTAIR | ~+15% over 1m |
Asia AI at Risk, GSXARISK | ~+15% over 1m |
These baskets rallied during July’s momentum unwind but have already started to give back gains. Goldman sees the squeeze as an opportunity to re-short structural AI losers.
The logic is that companies disrupted by AI may temporarily rally when AI winners de-gross, but their fundamental challenges remain.
Europe China Competition Losers
Goldman also highlights structurally challenged European multinationals vulnerable to China competition:
GSXECHNX
This basket rallied +7% in July, but price action has dislocated from EPS. Valuation is now at the 85th percentile of its five-year history, making the rally fade attractive.
European Gas Consumers
Goldman sees European gas price risks skewed higher into year-end, which implies incremental margin pressure for gas-consuming stocks:
GSXETTFX
The basket has rebounded roughly 5% from June lows, but Goldman sees potential for that rebound to unwind if gas prices rise.
6. Key Watchlist: Policy, Electricity, France
As second-quarter reporting winds down, the next few weeks are relatively catalyst-light. But September brings more political noise.
US Electricity Pricing
Goldman is focused on electricity pricing as a key US policy area. They expect:
US IPPs: GSXUIPPs
Domestic Solar: GSXUSOLR
to benefit from a sharp increase in renewable energy capacity additions through 2030E.
This fits the broader AI / power theme: electricity demand, grid capacity, and generation investment are increasingly important equity drivers.
Europe Political Risk
In Europe, the key watchpoint is French election headlines. Goldman flags:
French Domestics: GSXEFRDO
as the most sensitive pocket to political risk and potential credit-spread widening.
Historically, periods of heightened political uncertainty coincide with correlation spikes between French domestics / internationals and OAT-Bund spreads. In other words, French domestic equities become more macro-credit sensitive during political stress.
7. Factor Vol vs Index Vol: The Core Market Structure Problem
One of the most important points in the note is the divergence between factor vol and index vol.
Momentum factor vol is at post-COVID highs.
The spread between US high-beta momo realized vol and SPX realized vol is one of the largest in a decade.
Index vol remains relatively muted.
This is the same broader theme seen across dispersion, AI unwind, and crowded factor positioning: enormous volatility under the surface, but index volatility has not fully caught up.
That creates two possible outcomes:
Benign Outcome
Factor unwind continues to normalize.
Long-only investors add slowly.
Buybacks provide support.
Index remains rangebound.
Factor vol falls back toward index vol.
Stress Outcome
Correlations rise.
Macro shock hits.
Index vol catches up.
Dispersion shorts are squeezed.
Reverse dispersion / index vol protection works.
Given August liquidity and Fed / rates / geopolitics risk, Goldman still prefers limited-loss structures and protective trades.
8. Tactical Trade Map
Theme | Preferred Expression | Rationale |
|---|---|---|
Momo rebound | GSXUHMOM Sep 120/150 call spread | Washed-out positioning, limited-loss upside |
EU momo rebound | GSXEHMOM Sep 105 call | Cheaper convex upside after selloff |
AI hardware rebound | GSTMTDAT, GSSBSEMI, GSXEAICP, GSXABOTL | Fundamentals intact, positioning cleaner |
Hyperscalers vs non-profitable tech | Long GSXUHYPR vs short GSXUNPTC | Profitable AI platforms should outperform rate-sensitive unprofitable tech |
Fade AI losers | Short GSTMTAIR / GSXARISK | July squeeze offers re-entry into structural shorts |
Fade China-exposed Europe losers | Short GSXECHNX | Valuation dislocated from EPS |
European gas risk | Short GSXETTFX | Gas price risks skew higher into year-end |
US electricity winners | Long GSXUIPPs / GSXUSOLR | Renewable capacity additions / power demand |
France political risk | Watch / hedge GSXEFRDO | Sensitive to OAT-Bund widening |
9. What This Means for the Broader Market
The broader market implication is that the worst of the momentum liquidation may be behind us, but the market is not yet ready for a clean beta rally.
Why?
Positioning is cleaner but not outright low on a five-year basis.
Factor volatility remains very high.
Index vol has not fully repriced.
Long-only investors are still cautious.
August liquidity is poor.
Systematic downside flow risk remains asymmetric.
Macro risks remain live: rates, Fed credibility, oil, geopolitics.
Earnings catalysts become lighter after the Mag 7 reports.
That suggests the market can bounce, but rallies are likely to be uneven and leadership-specific.
Preferred leadership:
AI hardware
Datacenters
Semis
Power / electricity
Profitable hyperscalers over non-profitable tech
AI adopters / productivity beneficiaries
Avoid / fade:
AI-at-risk losers
Structurally challenged Europe / China-exposed multinationals
Gas-consuming European equities
Unprofitable tech in a high long-end-rate regime
Disclaimer: The material provided is for information purposes only and should not be considered as investment advice. The views, information, or opinions expressed in the text belong solely to the author, and not to the author’s employer, organization, committee or other group or individual or company.
Past performance is not indicative of future results.
High Risk Warning: CFDs are complex instruments and come with a high risk of losing money rapidly due to leverage. 69% and 73% of retail investor accounts lose money when trading CFDs with Tickmill UK Ltd and Tickmill Europe Ltd respectively. You should consider whether you understand how CFDs work and whether you can afford to take the high risk of losing your money.
Futures and Options: Trading futures and options on margin carries a high degree of risk and may result in losses exceeding your initial investment. These products are not suitable for all investors. Ensure you fully understand the risks and take appropriate care to manage your risk.
Patrick has been involved in the financial markets for well over a decade as a self-educated professional trader and money manager. Flitting between the roles of market commentator, analyst and mentor, Patrick has improved the technical skills and psychological stance of literally hundreds of traders – coaching them to become savvy market operators!